Notice: Undefined index: HTTP_ACCEPT_LANGUAGE in /www/wwwroot/www.nanofcm.com/wp-content/plugins/NanoFCMEditor/main.php on line 25
Comprehensive characterization – NanoFCM

Physical Properties: Size Distribution and Particle Concentration

Author: admin     Date: February 20, 2024

EV content has been gaining increasing interest from the EV research community, primarily mRNAs, miRNAs and proteins. In addition, particular markers exposed on the lipid bilayers that determine specific interactions with target cells. However, it has been suggested that physical properties of the particles may also affect the behavior of EVs, such as the way they mediate intercellular-communication. In fact, in the case of engineered nanoparticles, it has been shown that their size may affect the uptake efficiency and kinetics, the internalization mechanism and also the subcellular distribution. Whether the size of natural vesicles might be also an essential factor that determines how easily they can diffuse in a tissue and how effectively cells can take them up is still unknown and represents the overarching question behind this study. Exosome size is reported to vary from 30-150 nm and, as a consequence of the small nature of the particles, an accurate size estimation tends to be elusive.

image.png

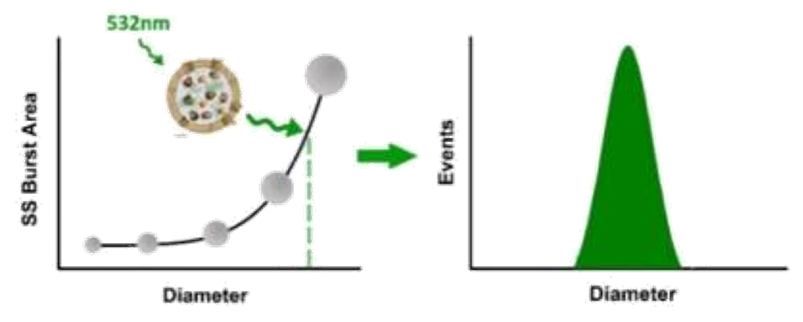
Here, monodisperse silica nanoparticles are used as the size reference standards. Therefore, the SS intensity of every single EV particle can be converted to particle size. Employing fluorescent nanoparticles of a known concentration as internal standard, the particle concentration of EVs can be acquired.

1677720506568051.webp

Figure 1. Comparison of TEM, Flow NanoAnalyzer, and NTA for particle size distribution analysis of silica nanoparticles.

1677720512100321.webp

Figure 2. Size distribution analysis of EVs

1677720521950973.webp

Figure 3. Particle concentration determination by Flow NanoAnalyzer.

ACS Nano, 2018, 12(1), 671-680.

Protein AnalysisProtein Analysis

Author: admin     Date: February 20, 2024

The biomolecular cargo (i.e., proteins, nucleic acids and lipids) of EVs is thought to reflect the cell-type of origin, suggesting it could be a promising source for the discovery of novel biomarkers. Earlier research has indicated that tetraspanins (CD9, CD63, CD81) are the specific markers of exosomes. However, further research is required before EV researchers can propose a list of EV-specific “markers” that distinguish subsets of EVs from each other. 

Here CD9 and CD63 are employed as the model protein. The expression of CD9 is verified by immunofluorescent labeling, while the expression of CD63 is verified by analyzing EVs isolated from CD63-eGFP stable clones.

1677721030516211.webp

Figure 1. Single particle analysis of intrinsic fluorescent CD63-EGFP EVs.

1677721036413477.webp

Figure 2. Single particle analysis of immunofluorescent labeled EVs (CD9-AF488 EVs)

The Flow NanoAnalyzer has the capacity of single EVs analysis, for both intrinsic fluorescent EVs and immunofluorescent labeled EVs, the population of fluorescent positive EVs can be discriminated from non-fluorescent populations.

Copyright © 2019 NanoFCM Inc.

Nucleic Acids and Lipid Analysis

Author: admin     Date: February 20, 2024

EV cargo including RNA, DNA, proteins, lipids, and metabolites, can be found internally and on the surface of EVs.  The cargo can be transferred to recipient cells, resulting in a pleiotropic response. Insights into the function of EVs can be obtained either by measuring the composition or by assays in which the function can be evaluated.

Here, SYTO™ RNASelect Green Fluorescent Stain is used to label the mRNA and miRNA of the EVs, whereas PKH26 is utilized to label the lipid membrane of the EVs.

1677721516448119.webp

Figure 1. RNA analysis of EVs extracted from cell culture using SYTO™ RNASelect Green Fluorescent dye

1677721521564157.webp

Figure 2. Lipid analysis of EVs extracted from plasma using PKH26.

With fluorescent labeling by SYTO™ RNASelect Green Fluorescent dye, the RNA of EVs can be characterized and the sub-population can be discriminated from non-fluorescent EVs.

Copyright © 2019 NanoFCM Inc.