

Comprehensive Analysis of Lentiviruses
Author: Mika Mika Date: May 23, 2022
Label-free Analysis of lentivirus
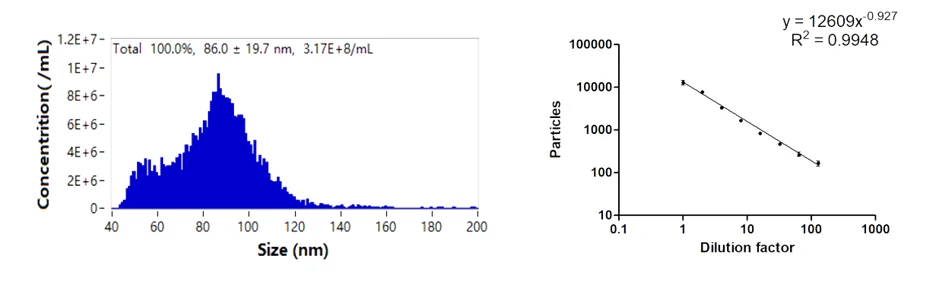
By label-free analysis of lentivirus at single particle level, NanoFCM allows the physical characterization, providing particle concentration and size distribution information in 2-3 minutes. The size ranges from 44 nm to 140 nm, with median value falls at 86.0 nm for this sample. The total particle concentration is 3.17 E11 particles/mL. What’s more, the gradient dilution result shows that NanoFCM possesses good linear correlation (R2 = 0.9948) towards lentivirus.
Structural and component analysis of lentivirus
In clinical applications, the purity and quality of the relevant preparations need to meet the GMP standards for gene therapy. However, the production of lentivirus might introduce nonviral impurities (cell debris, protein aggregates etc.) and viral impurities (empty capsids, free RNA etc). Hence, it is necessary for multi-dimensional quantitative analysis of by-products and final products during lentivirus production process.
-
Purity measurement by labeling membrane
Purity analysis of particles with membrane structures during lentiviral production can be performed with the aid of membrane dyes. Identification of particles labeled by a red fluorescent lipid membrane dye, nFCM data showed that the purity of lentivirus sample was 91.2%, revealing the majority of the particles contain an outer membrane structure. Also, the fluorescence intensity was positively correlated with the particle size.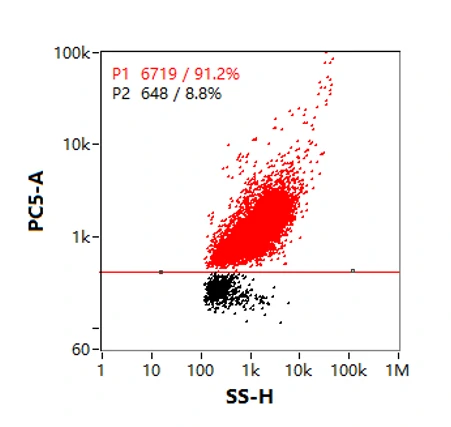
-
Analysis of nucleic acid encapsulation efficiency
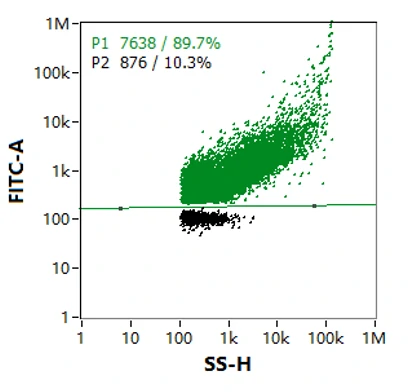
By labelling with cell membrane permeable nucleic acid dye, NanoFCM is able to discriminate the particles with or without RNA genomes. As shown in Figure, the majority of particles in this lentivirus sample were successfully loaded with genome (89.7%) while the rest of it were not.
-
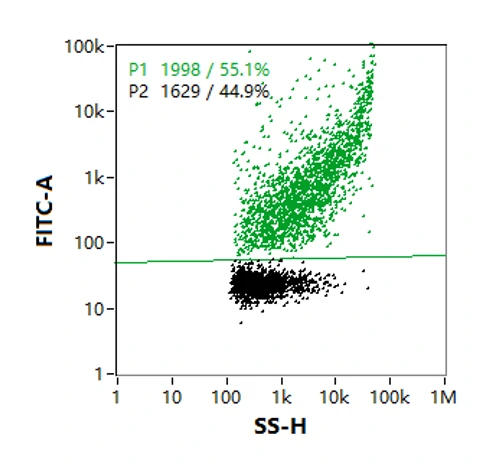
Identification of Capsid Protein p24
The p24 ELISA kit is the most commonly used method for measuring lentiviral titer, while p24 within the lentivirus as well as free p24 in the solution will be counted. With the treatment of transmembrane permeable reagent and antibody labeling, NanoFCM enables quantitative analysis of lentiviral internal proteins such as p24. The figure shows that p24 was present in 55.1% of particles in this sample, which indicates that not all lentiviral particles have p24 protein.
-
Measurement of Infectious Lentiviruses
Co-localization of Nucleic Acid and VSV-G
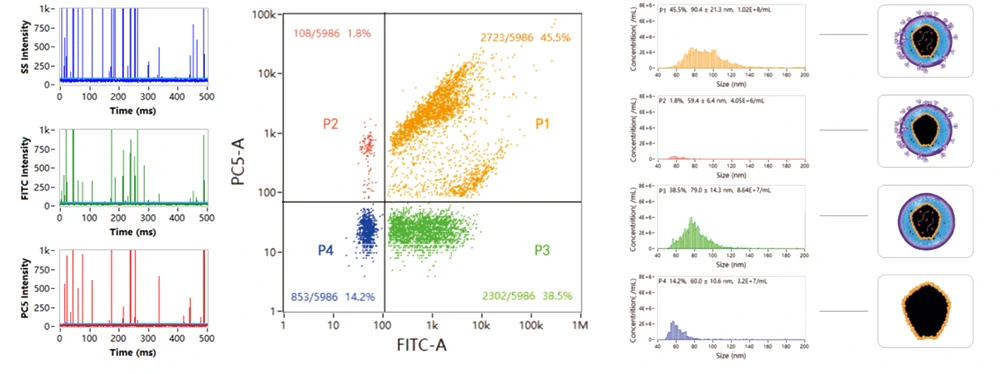
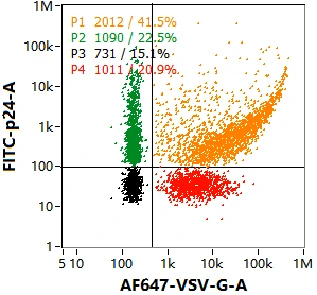
Multiple components tend to coexist in lentiviral samples, such as mature virions, partially assembled virions, free nucleic acids, etc. VSV-G positive lentivirus can infect cells——"recognition"; nucleic acid positive lentiviruses carry target genes——"cargo". Therefore, fully functional lentivirus will at least contain both the genome and VSV-G. Through nucleic acid and VSV-G dual-labeling, four well resolved populations are observed in the dotplot, with size distribution and particle concentration displayed on the right panel. Combing the labeling strategy, NanoFCM is able to provide rapid, high-throughput, comprehensive characterization of functional lentivirus.
Colocalization analysis of lentiviral nucleic acids, proteins, and lipid membrane
The advantages of multi-parameter characterization by NanoFCM, such as scattering channel and multicolor fluorescent channels, and the colocalization analysis of nucleic acid, membrane protein, internal protein and plasma membrane at the single particle level opens the way to the characterization in other application scenarios.
Comparison of the lentiviral Titer Measurements
In contrast to the p24 quantification method, NanoFCM directly determines the particle concentration of active lentivirus by labeling the p24 protein within the capsid. A method for rapid and quantitative analysis of functional lentiviruses was further developed by nucleic acid and VSV-G dual-labeling. This figure compares the results of lentiviral quantitative analysis based on NanoFCM and transduction titers, and the result indicated the particle-to-PFU ratio of lentivirus is above 100, which was aligned with p24 quantitative analysis via ELISA (each TU contains 100-1000 particles).
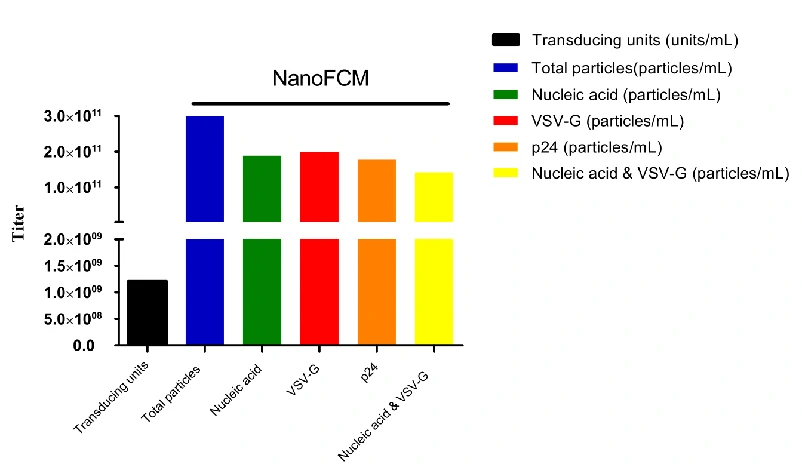
*Notes:particle-to-PFU ratio is a measure of the fraction of virus particles in a given sample that can complete an infectious cycle. For many bacteriophages, the particle-to-PFU ratio approaches 1. For animal viruses, the particle-to-pfu ratio is often much higher, from 1 to 10,000.
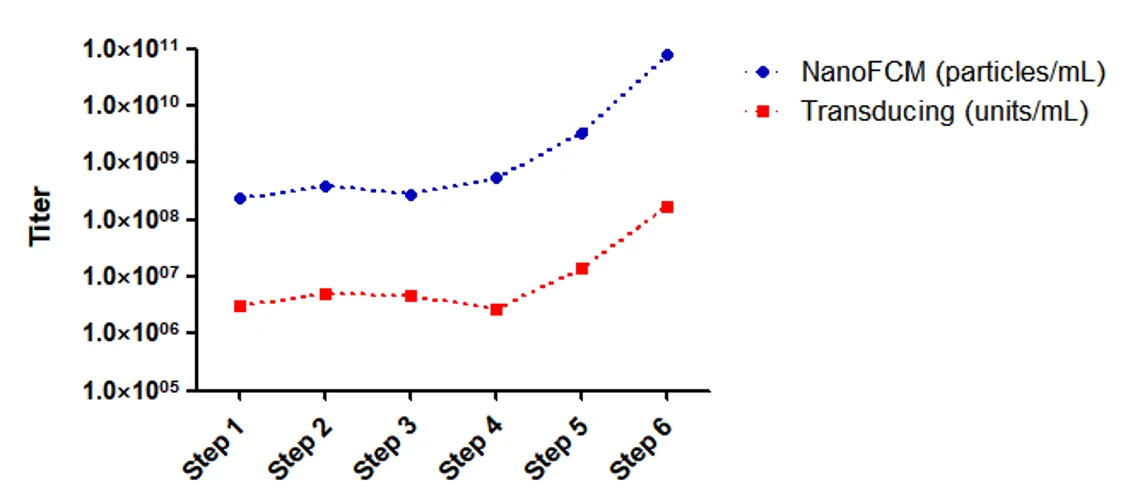
Optimization of Technological Process
NanoFCM can monitor the production process, assessing product quantity and purity. The right figure shows the change of transduction titer (red) and physical titer (blue) along with different steps of lentivirus production and purification, and both curves follow the similar trend. With the help of NanoFCM and the nucleic acid & VSV-G dual- labeling strategy, real-time monitoring of key steps during purification and optimize the production process can be achieved, thus assisting the establishment of optimized purification and manufacuring workflow.